Tuesday, December 20, 2005

Russell 2000 is still in consolidation


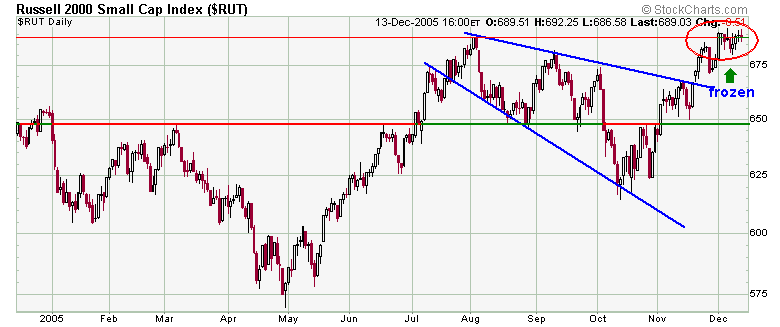
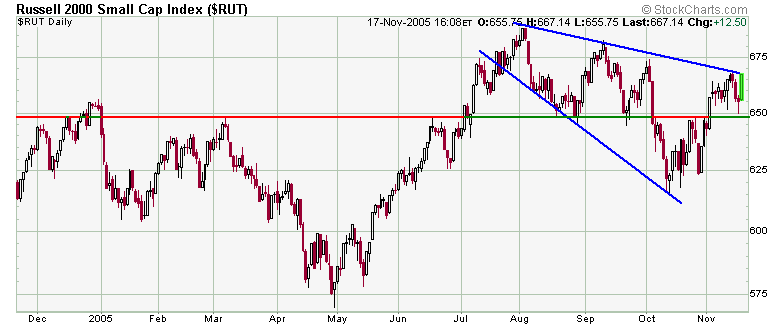
Russell 2000 closed just right above the support today after going below it during the morning hours. We are still in bull bear fight , bears have been the gaining upper hand during the past days(or last 3 weeks) during which the market went no where and then suddenly in the last days it went down as if the pillar holding it got struck down. We need this type of shock and fear (or awe) in order to scare the optimists and the fearless and recently converted bulls.
I still expect the market to clear this range and go upwards,but if Russell2000 goes up a little and takes out the next support at 661, i might reverse my position, until then it's a risk holding long stocks. But reward is for who takes the risk. (just on the side , i have a little fear too).
If the market want to go up, it's going to be a big fight since a lot of over head resistance lies ahead.Patience is the medicine that's needed.
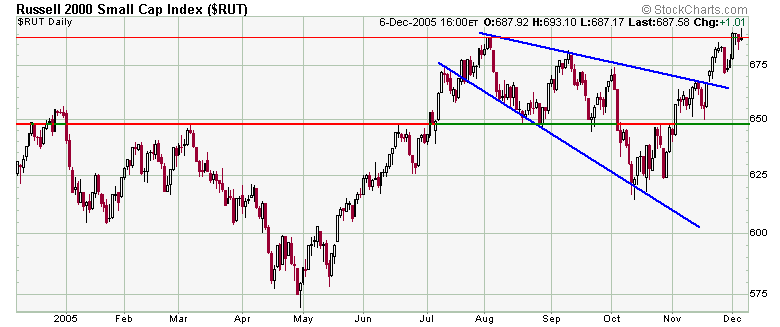
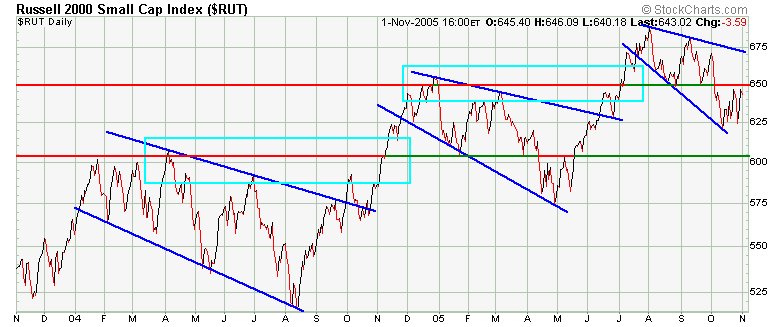
As mentioned in my Dec 06 posting, the market is range bound and is showing some signs that it may be positioning itself for a little move higher.

"Merry Christmas"
"Love is the greatest of all the gifts" .

Tuesday, December 13, 2005

Russell 2000 in Consolidation


Russell 2000 has been at the same point for past 2 weeks, this is pure consolidation after a big Up move. Don't know when it will breakout of this consolidation. If it breaks out , sometimes it can comeback to this level to consolidate more, so that it can make a big move up later.
One thing i learned from all these years is Patience is the most important thing an investor(or trader) needs, if you act on your emotions and sells the stocks because you are bored and market is going no where, that's when it goes up. How many times that happened to you?Many times for me. Learning new lessons everyday.

Tuesday, December 06, 2005

Russell 2000 and Market tired


Even though Russell 2000, brokeout of its prior high, it came back to that level and is stuck there for the past days. The market is telling us that it's tired of going higher, it needs more energy and inorder to get that it needs to consolidate . I think the market will trade in a range for the next couple of weeks.
As mentioned in a chart below, Oil stopped at the trendline and is climbing up. Oil may be on its last gasp higher, before it goes into a minor bear.

Sunday, December 04, 2005

Bye Bye Nasdaq 2000, Hello 3000

When Nasdaq bottomed in 2002, it did that just above the 1000 point mark. Nasdaq reached the 2000 area around the first part of 2004 and it stayed around that area for the past 22 months(almost 2 years). Now it build a very good base around the 2000 area and now looking forward to meet the next multiple , 3000.But if you look at the chart above, the move up is going to get stopped at around 2775, a point similar to the area nasdaq just left(shown by the down blue arrows). Before it gets there the market will have to make a stop just below 2350 and build enough base to attack and move to the next resistance level at 2775.Going above 2775, is for another day,it may take years, but eventually will, we will see when it gets there. So bye bye 2000.

Friday, December 02, 2005

Russell 2000 looks strong and brokeout


(Click chart to enlarge)
Russell 2000 looks strong here, and went up on good volume(as measured by IWM, the small cap ETF). It cleared the thin redline at the top of the chart, which was its prior recent high.
It looks like the market will continue its uptrend with pullbacks here and there. But watch for trend reversal(downtrend)!, since there is no certainity in the market. it's all about collective psychology.

Saturday, November 26, 2005

Oil prices might be headed higher


Oil price as shown in the chart above is on the trendline, that has provided support in the past. So, oil prices ,might be headed higher in the coming weeks. But, if the price fails the trendline by going below it, then expect lower prices at the pump. Good for Houston economy, where i'm based.!

Russell 2000 looks good - bullish trend in place

(click chart to enlarge)
Russell 2000 brokeout of the the broadening triangle formation with good volume.(volume based on IWM, the small cap Ishare). There might be some consolidation coming , since we have been going up for the past several weeks. A puase in the uptrend is always good for the market.

Thursday, November 17, 2005

Russell 2000 stopped at the Upper trendline


(click chart to enlarge)
Russell 2000 closed right at the upper trendline today. Will there be a breakout tomorrow, don't know?. Watch for fake breakout(the one with light volume)!.

Wednesday, November 16, 2005

Russell 2000 hits 650 and bounced back

(click the chart to enlarge)
Russell 2000 , as explained below, traced back to 650 and bounced back today. But unless it crosses above the upper trendline(blue line descending) with good volume all bets are off for this move up. I think the Market is in a consolidation phase after the run up from October and the above pattern usually resolves to the upside in most cases, but the fact is , as stated above it has to cross the line!.

Sunday, November 13, 2005

OIl vs USD

(The green line indicates the Oil price and the red line , the US Dollar value.)
The above picture shows the current general direction of the Crude oil prices and USD value. The oil prices have been trending up since 2002 and USD has been trending down since 2002.
Commodity prices go up or down based on supply and demand. Oil prices went up because of supply concerns from world over and demand increases from developing nations like China,India and increased economic activity in the Asian tiger countries.
Oil is traded in US Dollars, so if the USDollar goes up or down in value the price of oil changes. So, if the dollar goes down in value the Oil price goes up, since it requires more dollar to purchase the same amount of oil and maintain the same profitability.
Since the oil demand has been strong for the past years and the dollar value has been going down, oil prices shot up.
Since the second quarter of 2005 , USD value has been going up and we are seeing now ,a downward move in oil prices. since the demand is strong Oil prices will stay high above the average prices we have seen in the last decade even if the USD value goes up. But if the USD remains strong and there's a slight indication that oil demand is slackening, the oil prices will plunge (like in late 90s -below chart) because less dollars will be needed to purchase the same amount of oil.
The above chart is from 1995 to 1998.
You can see clearly the relation between Oil vs USD vs Oil supply/demand. Oil and Dollar was trending up in 95 and 96, In 97 when Dollar (in red) value shoot up, OIl started trending down, and in 1998 when Asian Tiger countries started have economic issues, Oil came plunging down due to poor demand and high value of the USDollar.
Can the same story repeat this time? Don't know, but one thing is going in the right direction, the value of the USDollar, it has been treding up since june 2005.

Wednesday, November 09, 2005

Russell 2000 crosses 650 resistance


Russel 2000 index is still within the broadening descending triangle pattern. It has reached the upper end after passing through the resistance(indicated by the green and red horizontal line) at 650.I think we will go back and forth for a couple of days and then do a breakout. If it fails that 650 line all hopes of a breakout are out.

Tuesday, November 01, 2005

Russell 2000 on a familiar pattern

Russell 2000 has broken out a couple of times as seen in the picture from a bullish widening triangle pattern. It's forming a similar pattern now. First, it has cross the 650 resistance. Does it fail or succeed this time? Don't know?. But if it breaks out , it will be a big RALLY.

Followers