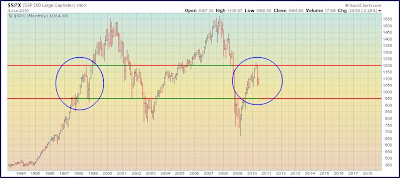
 Updated chart from prior post. As in prior post , i think the market is still in the process of a sideways trading range and eventually will break above 1220(the top line), but the timing is uncertain. My initial target is 1250 for the current up trend. and then the next up cycle will take it to 1350.
Sunday, September 26, 2010
Continuation of Up Trend
 Updated chart from prior post. As in prior post , i think the market is still in the process of a sideways trading range and eventually will break above 1220(the top line), but the timing is uncertain. My initial target is 1250 for the current up trend. and then the next up cycle will take it to 1350.
Saturday, June 05, 2010
is SPX retracing an old pattern?
 (click image to enlarge)
Market's run from March 2009 finally stopped at 1220 and we have moved into a bear market pattern unless market climbs back above 1105 quickly. In the graph above, if the current pattern retraces a similar move back in 1997-1998(Asian currency crisis) i guess 950 is the bottom of the range(Do we call that Euro crisis?). I still don't know if the market will come all the way down to 950, but it should stay above 950 if it comes down. If the market climbs above 1105 in the near term, this bearish pattern is negated. Also 1010 area is a support area above 950.
Subscribe to:
Comments (Atom)