Saturday, May 09, 2009

Warning Signs


There are some warning signs in the horizon for the stock market.
The chart on the right side shows the ratio of Nasdaq vs S&P500 on a daily basis . Whenever this goes down and crosses 50 day moving average to the downside , the market also went down with it . Don't know if that's the case this time. Also I don't know if this is a short term issue due to rotation of money out of tech stocks and moving into banking stocks. But nevertheless this needs to be watched.

Sunday, March 15, 2009

Has the Market hit a low at 666 on the S&P500?


(click on image to enlarge)
As you can see in the above image, the S&P 500 dropped below the long term up trend-line(red-line) from the 1980s, stayed there for a couple of days, then regained strength and went above the trendline. Also on the Fibonacci retrace , 666 is the 61.8% of the move from 1982 to 2007. So we have two technical patterns agreeing on this low. Now in order for this to be "the bottom" we need a retest. If the market falls significantly below 666 on the next leg down, then this pattern is null and void.

on Fibonacci retracement : http://www.investopedia.com/terms/f/fibonacciretracement.asp

Sunday, December 28, 2008

Where is the market now?

Updated Chart:


2008 has been a horrific year for investors. There are a lot of people who lost a lot of money and have lost confidence in the long-term sustainability of the market. So where's the market right now. (click the chart to enlarge)
On looking at the Nasdaq, it did retrace back to 1600 , which is 50% of the down move from 1900(october gap) to 1300(market low). For the non-technicians what this means is , the market made a bottom on Nov 21st 2008, went up and hit tremendous selling at the 1600 level. So for the market to make any big move right now it has to power through that level(1600) and in order for market participants to take it past that level, they need to see evidence that there's further easing of the credit crisis and some kind of a recovery in spring 2009.Other wise we will see further price declines in 2009.
For the long term: (click the chart to enlarge)
In the picture above you can see that Dow jones average went sideways after a prolonged bull market.(see 1905-1920, 1965-1982).Usually the price earnings has to go below 10 inorder for the next long-term bull market (ie one that lasts ~14-20 years , for example from 1982-2000). I think we are in one of those situations were we go sideways for a long time.ie. Even if we get back to highs we put in 2007, we still be in a long-term trading range.

Sunday, August 03, 2008

long term market trend

( click on the image to enlarge it.)

A stock chart of an index , like s&p500 , can be used to determine when a major bull market starts and when it ends. As you can see in the chart , it started in 2003 may-june and ended in 2008 January.

In a capitalistic economy, after a cycle of economic growth we have to shed the excesses to start anew (in this cycle the excess is housing&banking , last cycle it was technology, in the next cycle it might be Energy) . This shedding of excesses could take some time depending on the magnitude of it. Stock Market usually turns up way before the economy turns. Actually it turns up when people have no interest in buying stocks due to the gloomy economy at that time period.

But charting can be used to determine when the economy is going to turn and to start buying stocks. This method could be used to allocate your long-term investments.

In the picture above i've identified some markers which could be used to identify the next turn. Any free charting website could provide you this information.


Hope i use this the next time it turns around.


Saturday, June 21, 2008

long term s&P trend is down for now-watch the monthly chart

watch for cross up or down of price on the 21-month moving average.currently price went below averge in in jan-2008, and it retraced back to averge line in May and pulled back.

Friday, October 13, 2006

Market At Decision TIme


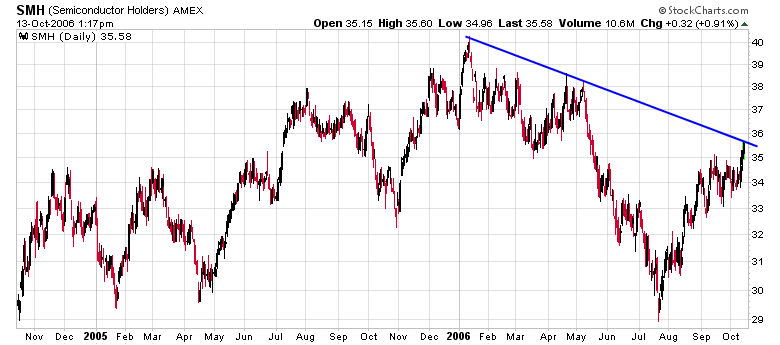
The stock market has been going up in bull mode since july of this year. But the time has come to pause and refresh (if the market wants). The SMH chart above shows that it's at the trendline resistance. If it breaks above the trendline then the ride up will last a little longer.
Does it break above or not? bulls are laughing all the way to the bank , bears are scared but no at extreme level. May be SMH has to break above the trendline to break the back of the bear and bulls to get giddy.

Sunday, February 12, 2006

Dow will cross 11,000 again


As the chart above depicts, Dow Jones Average is going to cross 11000 again and go some where around 11250-11300 or more . This shows that the largecaps are going to outperform the smallcaps represented by the Russell 2000. Stocks like DE,HON might be good for this cycle.

Saturday, January 07, 2006

Russell 2000 broke resistance and moving

Happy New Year.
As mentioned in the December 6th posting, the market needed a rest and it consolidated for the past 4-5 weeks.Now it brokeout yesterday from that consolidation range and it looks like will continue its upward movement.
But there's always a catch.It's like whether the market got enough rest last month to continue the upward move and not fall back. So watch for market not to fall back below 690. If it does, then it will continue to consolidate. Looking at other market indexes and components market is in good shape to continue its move upward.

Tuesday, December 20, 2005

Russell 2000 is still in consolidation


Russell 2000 closed just right above the support today after going below it during the morning hours. We are still in bull bear fight , bears have been the gaining upper hand during the past days(or last 3 weeks) during which the market went no where and then suddenly in the last days it went down as if the pillar holding it got struck down. We need this type of shock and fear (or awe) in order to scare the optimists and the fearless and recently converted bulls.
I still expect the market to clear this range and go upwards,but if Russell2000 goes up a little and takes out the next support at 661, i might reverse my position, until then it's a risk holding long stocks. But reward is for who takes the risk. (just on the side , i have a little fear too).
If the market want to go up, it's going to be a big fight since a lot of over head resistance lies ahead.Patience is the medicine that's needed.
As mentioned in my Dec 06 posting, the market is range bound and is showing some signs that it may be positioning itself for a little move higher.

"Merry Christmas"
"Love is the greatest of all the gifts" .

Tuesday, December 13, 2005

Russell 2000 in Consolidation


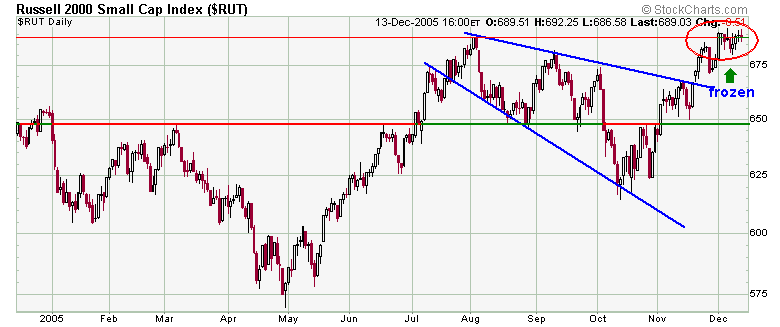
Russell 2000 has been at the same point for past 2 weeks, this is pure consolidation after a big Up move. Don't know when it will breakout of this consolidation. If it breaks out , sometimes it can comeback to this level to consolidate more, so that it can make a big move up later.
One thing i learned from all these years is Patience is the most important thing an investor(or trader) needs, if you act on your emotions and sells the stocks because you are bored and market is going no where, that's when it goes up. How many times that happened to you?Many times for me. Learning new lessons everyday.

Tuesday, December 06, 2005

Russell 2000 and Market tired


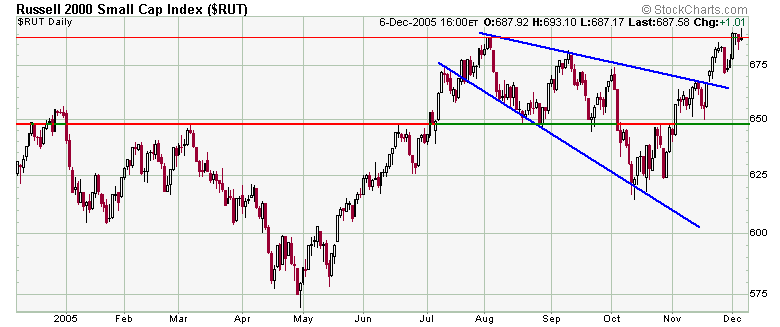
Even though Russell 2000, brokeout of its prior high, it came back to that level and is stuck there for the past days. The market is telling us that it's tired of going higher, it needs more energy and inorder to get that it needs to consolidate . I think the market will trade in a range for the next couple of weeks.
As mentioned in a chart below, Oil stopped at the trendline and is climbing up. Oil may be on its last gasp higher, before it goes into a minor bear.

Sunday, December 04, 2005

Bye Bye Nasdaq 2000, Hello 3000

When Nasdaq bottomed in 2002, it did that just above the 1000 point mark. Nasdaq reached the 2000 area around the first part of 2004 and it stayed around that area for the past 22 months(almost 2 years). Now it build a very good base around the 2000 area and now looking forward to meet the next multiple , 3000.But if you look at the chart above, the move up is going to get stopped at around 2775, a point similar to the area nasdaq just left(shown by the down blue arrows). Before it gets there the market will have to make a stop just below 2350 and build enough base to attack and move to the next resistance level at 2775.Going above 2775, is for another day,it may take years, but eventually will, we will see when it gets there. So bye bye 2000.

Friday, December 02, 2005

Russell 2000 looks strong and brokeout


(Click chart to enlarge)
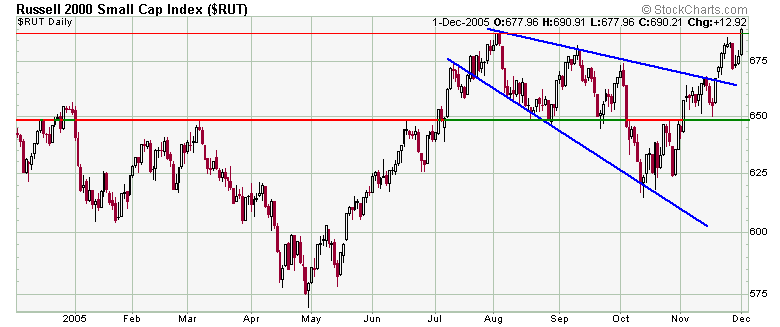
Russell 2000 looks strong here, and went up on good volume(as measured by IWM, the small cap ETF). It cleared the thin redline at the top of the chart, which was its prior recent high.
It looks like the market will continue its uptrend with pullbacks here and there. But watch for trend reversal(downtrend)!, since there is no certainity in the market. it's all about collective psychology.

Saturday, November 26, 2005

Oil prices might be headed higher


Oil price as shown in the chart above is on the trendline, that has provided support in the past. So, oil prices ,might be headed higher in the coming weeks. But, if the price fails the trendline by going below it, then expect lower prices at the pump. Good for Houston economy, where i'm based.!

Russell 2000 looks good - bullish trend in place

(click chart to enlarge)
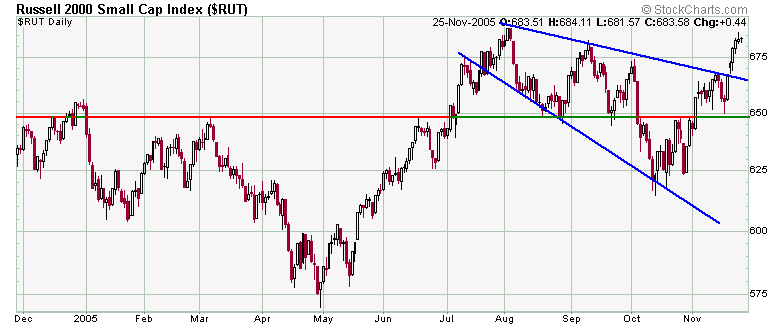
Russell 2000 brokeout of the the broadening triangle formation with good volume.(volume based on IWM, the small cap Ishare). There might be some consolidation coming , since we have been going up for the past several weeks. A puase in the uptrend is always good for the market.

Thursday, November 17, 2005

Russell 2000 stopped at the Upper trendline


(click chart to enlarge)
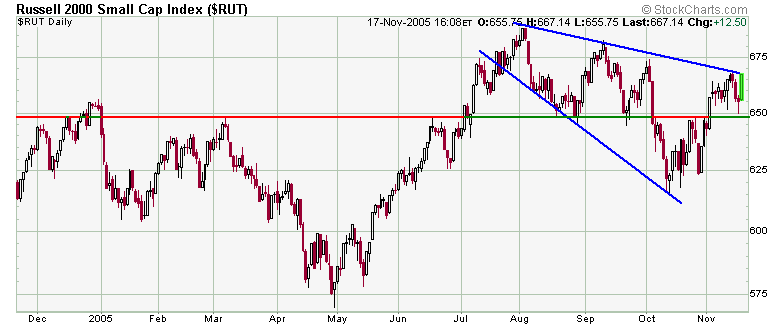
Russell 2000 closed right at the upper trendline today. Will there be a breakout tomorrow, don't know?. Watch for fake breakout(the one with light volume)!.

Wednesday, November 16, 2005

Russell 2000 hits 650 and bounced back

(click the chart to enlarge)
Russell 2000 , as explained below, traced back to 650 and bounced back today. But unless it crosses above the upper trendline(blue line descending) with good volume all bets are off for this move up. I think the Market is in a consolidation phase after the run up from October and the above pattern usually resolves to the upside in most cases, but the fact is , as stated above it has to cross the line!.

Sunday, November 13, 2005

OIl vs USD

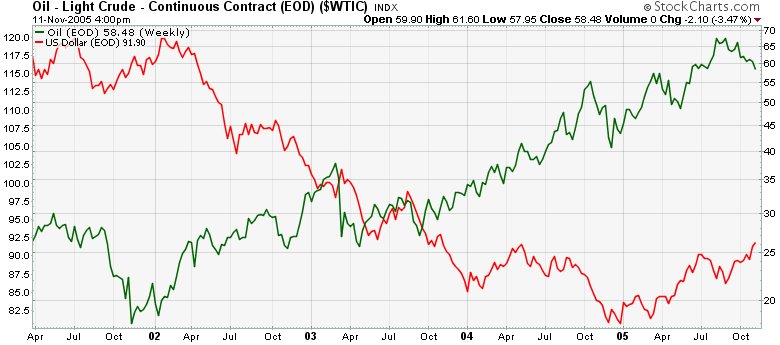
(The green line indicates the Oil price and the red line , the US Dollar value.)
The above picture shows the current general direction of the Crude oil prices and USD value. The oil prices have been trending up since 2002 and USD has been trending down since 2002.
Commodity prices go up or down based on supply and demand. Oil prices went up because of supply concerns from world over and demand increases from developing nations like China,India and increased economic activity in the Asian tiger countries.
Oil is traded in US Dollars, so if the USDollar goes up or down in value the price of oil changes. So, if the dollar goes down in value the Oil price goes up, since it requires more dollar to purchase the same amount of oil and maintain the same profitability.
Since the oil demand has been strong for the past years and the dollar value has been going down, oil prices shot up.
Since the second quarter of 2005 , USD value has been going up and we are seeing now ,a downward move in oil prices. since the demand is strong Oil prices will stay high above the average prices we have seen in the last decade even if the USD value goes up. But if the USD remains strong and there's a slight indication that oil demand is slackening, the oil prices will plunge (like in late 90s -below chart) because less dollars will be needed to purchase the same amount of oil.
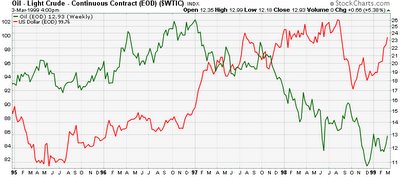
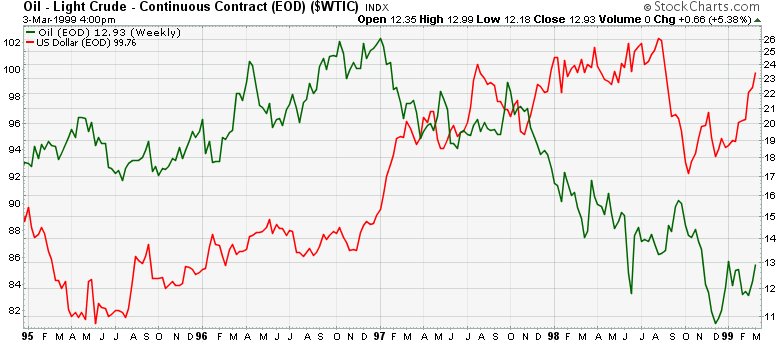
The above chart is from 1995 to 1998.
You can see clearly the relation between Oil vs USD vs Oil supply/demand. Oil and Dollar was trending up in 95 and 96, In 97 when Dollar (in red) value shoot up, OIl started trending down, and in 1998 when Asian Tiger countries started have economic issues, Oil came plunging down due to poor demand and high value of the USDollar.
Can the same story repeat this time? Don't know, but one thing is going in the right direction, the value of the USDollar, it has been treding up since june 2005.

Wednesday, November 09, 2005

Russell 2000 crosses 650 resistance


Russel 2000 index is still within the broadening descending triangle pattern. It has reached the upper end after passing through the resistance(indicated by the green and red horizontal line) at 650.I think we will go back and forth for a couple of days and then do a breakout. If it fails that 650 line all hopes of a breakout are out.

Tuesday, November 01, 2005

Russell 2000 on a familiar pattern

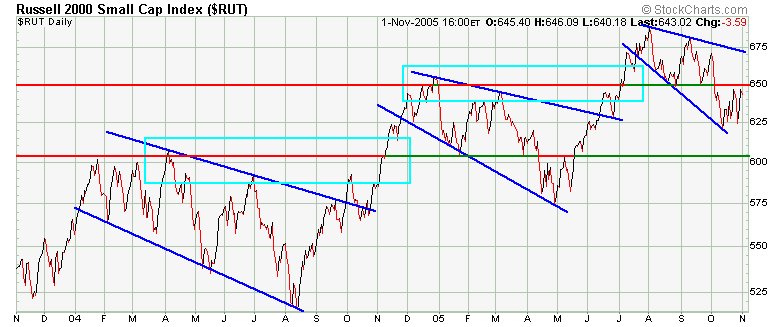
Russell 2000 has broken out a couple of times as seen in the picture from a bullish widening triangle pattern. It's forming a similar pattern now. First, it has cross the 650 resistance. Does it fail or succeed this time? Don't know?. But if it breaks out , it will be a big RALLY.

Followers