Sunday, March 25, 2012

Bonds are going down long term

The chart above is for TLT, which is a treasury bond ETF.  Investors buy treasury bonds when rest of the market is in trouble. Since investors have been moving to the stock market, treasuries have come down gradually. As you can see , TLT has solid support at the up trend-line, where it has stopped many times over the years and i guess it will stop again at that line. (If it ever falls below that line, you can kiss good bye to low interest rates for a long time. It could happen if inflation some how gets to a very high level, like in the early 1980s.). Not sure how long it will take for the TLT to come down and meet the trend-line. This is one of the reason i'm bullish on the stock market in the long-term.
possible trades: Short TLT  or long TBT (inverse ETF)

Disclaimer: The information on this blog is not a recommendation or solicitation to buy, sell or hold any security. This blog is strictly for informational and educational purposes only.

Saturday, March 24, 2012

Market to Sell-Off and Consolidate

The Market has been going up with out a major sell off in the past 3 months. I think it's time for a pullback and consolidation. As the chart shows, the S&P500 will be hitting the up trend-line pretty soon and it might rally from there or go below it. I think the  Market will be weak for the next couple of months, but not sure whether it will go down a lot too. We have to see how it consolidates here and whether it will create to a pattern to go up or down (My long-term prediction is the Market could go to 1500 area in the second half of the year, but there's no guarantee for that too). Once we Sell-off and consolidates i will post where it will be going next.

Saturday, December 10, 2011

To 1350 (not Infinity) and Beyond


As was said in the last post the market has been trending down and going sideways  for the past 6 months along with the uptrend in Bonds. I think we are at a stage where the market could start trending higher and Bond to trend lower , but not in a straight line though (see chart for a possible pattern) . But in the 2nd half of 2012, we could see the market(S&P500)  challenging 1400  and above.

Thursday, May 05, 2011

When Bonds Turn Up Stocks Retreat

Bonds have been in an uptrend for a long time , as the chart shows, it has been in that uptrend for almost 25 years. whenever the bond price bounces from the lower trendline, stocks go into a weak phase and vice-versa. I think stocks are going to be weak for the next couple of months. My guess is that S&P500 will remain weak and go into a downtrend phase, but later it will mount another rally to the 1500's during the election year(2012).

Sunday, September 26, 2010

Continuation of Up Trend

Updated chart from prior post. As in prior post , i think the market is still in the process of a sideways trading range and eventually will break above 1220(the top line), but the timing is uncertain. My initial target is 1250 for the current up trend. and then the next up cycle will take it to 1350.

Saturday, June 05, 2010

is SPX retracing an old pattern?

(click image to enlarge)
Market's run from March 2009 finally stopped at 1220 and we have moved into a bear market pattern unless market climbs back above 1105 quickly. In the graph above, if the current pattern retraces a similar move back in 1997-1998(Asian currency crisis) i guess 950 is the bottom of the range(Do we call that Euro crisis?). I still don't know if the market will come all the way down to 950, but it should stay above 950 if it comes down. If the market climbs above 1105 in the near term, this bearish pattern is negated. Also 1010 area is a support area above 950.

Saturday, September 26, 2009

Market encounters head winds

Since crossing 950 after the bull-bear tug-o-war(as mentioned in the prior blog entry), the market
gained almost 14%. It has been going up for the last seven months and we are just below a major resistance area in the s&p500 index. 1100-1150 is another area that has shown some consolidation in the prior up-down moves as you can see in the chart, ie. the market does not shoot straight up but consolidate or sell-off before moving up. If the market sells off then 950-980 area should provide good support.If it goes below 950 and stay below it then we have a major problem and will lead to another downturn in economic conditions. But at this point , i think the market will consolidate between 950 and 1125 and eventually go up to regain new highs.

Saturday, June 20, 2009

S&p500 index bull/bear tug-o-war


(click the chart on enlarge)

S&P 500 index has some work to do in order to climb above 950. On a daily or weekly basis the index still could climb above 950 but on a monthly basis it has to close above 950 and stay above it for the long term sustainability of the market.

As the chart shows, the market started having difficulty at this level starting in 1997. So everytime it revisits this area bulls and bears get into a tug-o-war. The bears will defend the area around 950 with all the weapons they have in their arsenal. Bulls having climbed from 666.79 is already tired(not enough capital to invest at this level inorder to power thru 950) and needs some rest. Once the rest period is over, the bulls need to accumulate enough energy to bring down the bears standing in line at 950. Don't know how long bears will have the strength to hold the bulls below 950. Watch and wait!

Saturday, May 09, 2009

Warning Signs


There are some warning signs in the horizon for the stock market.
The chart on the right side shows the ratio of Nasdaq vs S&P500 on a daily basis . Whenever this goes down and crosses 50 day moving average to the downside , the market also went down with it . Don't know if that's the case this time. Also I don't know if this is a short term issue due to rotation of money out of tech stocks and moving into banking stocks. But nevertheless this needs to be watched.

Sunday, March 15, 2009

Has the Market hit a low at 666 on the S&P500?


(click on image to enlarge)
As you can see in the above image, the S&P 500 dropped below the long term up trend-line(red-line) from the 1980s, stayed there for a couple of days, then regained strength and went above the trendline. Also on the Fibonacci retrace , 666 is the 61.8% of the move from 1982 to 2007. So we have two technical patterns agreeing on this low. Now in order for this to be "the bottom" we need a retest. If the market falls significantly below 666 on the next leg down, then this pattern is null and void.

on Fibonacci retracement : http://www.investopedia.com/terms/f/fibonacciretracement.asp

Sunday, December 28, 2008

Where is the market now?

Updated Chart:


2008 has been a horrific year for investors. There are a lot of people who lost a lot of money and have lost confidence in the long-term sustainability of the market. So where's the market right now. (click the chart to enlarge)
On looking at the Nasdaq, it did retrace back to 1600 , which is 50% of the down move from 1900(october gap) to 1300(market low). For the non-technicians what this means is , the market made a bottom on Nov 21st 2008, went up and hit tremendous selling at the 1600 level. So for the market to make any big move right now it has to power through that level(1600) and in order for market participants to take it past that level, they need to see evidence that there's further easing of the credit crisis and some kind of a recovery in spring 2009.Other wise we will see further price declines in 2009.
For the long term: (click the chart to enlarge)
In the picture above you can see that Dow jones average went sideways after a prolonged bull market.(see 1905-1920, 1965-1982).Usually the price earnings has to go below 10 inorder for the next long-term bull market (ie one that lasts ~14-20 years , for example from 1982-2000). I think we are in one of those situations were we go sideways for a long time.ie. Even if we get back to highs we put in 2007, we still be in a long-term trading range.

Sunday, August 03, 2008

long term market trend

( click on the image to enlarge it.)

A stock chart of an index , like s&p500 , can be used to determine when a major bull market starts and when it ends. As you can see in the chart , it started in 2003 may-june and ended in 2008 January.

In a capitalistic economy, after a cycle of economic growth we have to shed the excesses to start anew (in this cycle the excess is housing&banking , last cycle it was technology, in the next cycle it might be Energy) . This shedding of excesses could take some time depending on the magnitude of it. Stock Market usually turns up way before the economy turns. Actually it turns up when people have no interest in buying stocks due to the gloomy economy at that time period.

But charting can be used to determine when the economy is going to turn and to start buying stocks. This method could be used to allocate your long-term investments.

In the picture above i've identified some markers which could be used to identify the next turn. Any free charting website could provide you this information.


Hope i use this the next time it turns around.


Saturday, June 21, 2008

long term s&P trend is down for now-watch the monthly chart

watch for cross up or down of price on the 21-month moving average.currently price went below averge in in jan-2008, and it retraced back to averge line in May and pulled back.
Friday, October 13, 2006

Market At Decision TIme


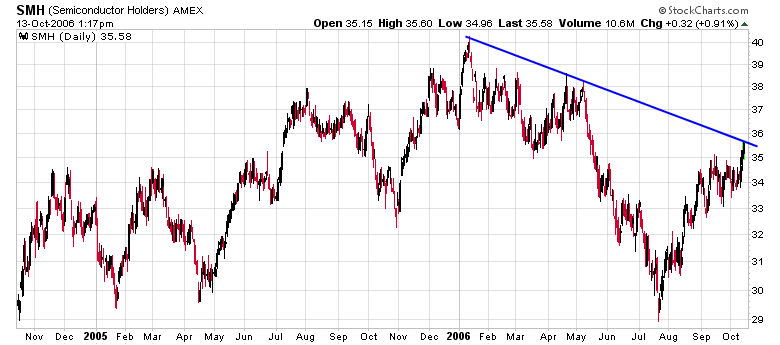
The stock market has been going up in bull mode since july of this year. But the time has come to pause and refresh (if the market wants). The SMH chart above shows that it's at the trendline resistance. If it breaks above the trendline then the ride up will last a little longer.
Does it break above or not? bulls are laughing all the way to the bank , bears are scared but no at extreme level. May be SMH has to break above the trendline to break the back of the bear and bulls to get giddy.

Sunday, February 12, 2006

Dow will cross 11,000 again


As the chart above depicts, Dow Jones Average is going to cross 11000 again and go some where around 11250-11300 or more . This shows that the largecaps are going to outperform the smallcaps represented by the Russell 2000. Stocks like DE,HON might be good for this cycle.

Saturday, January 07, 2006

Russell 2000 broke resistance and moving

Happy New Year.
As mentioned in the December 6th posting, the market needed a rest and it consolidated for the past 4-5 weeks.Now it brokeout yesterday from that consolidation range and it looks like will continue its upward movement.
But there's always a catch.It's like whether the market got enough rest last month to continue the upward move and not fall back. So watch for market not to fall back below 690. If it does, then it will continue to consolidate. Looking at other market indexes and components market is in good shape to continue its move upward.

Tuesday, December 20, 2005

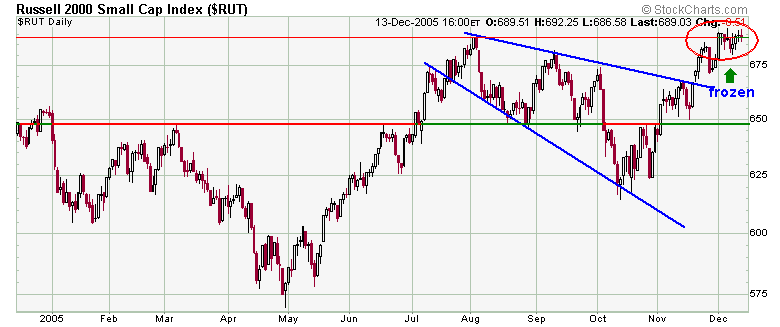
Russell 2000 is still in consolidation


Russell 2000 closed just right above the support today after going below it during the morning hours. We are still in bull bear fight , bears have been the gaining upper hand during the past days(or last 3 weeks) during which the market went no where and then suddenly in the last days it went down as if the pillar holding it got struck down. We need this type of shock and fear (or awe) in order to scare the optimists and the fearless and recently converted bulls.
I still expect the market to clear this range and go upwards,but if Russell2000 goes up a little and takes out the next support at 661, i might reverse my position, until then it's a risk holding long stocks. But reward is for who takes the risk. (just on the side , i have a little fear too).
If the market want to go up, it's going to be a big fight since a lot of over head resistance lies ahead.Patience is the medicine that's needed.
As mentioned in my Dec 06 posting, the market is range bound and is showing some signs that it may be positioning itself for a little move higher.

"Merry Christmas"
"Love is the greatest of all the gifts" .

Tuesday, December 13, 2005

Russell 2000 in Consolidation


Russell 2000 has been at the same point for past 2 weeks, this is pure consolidation after a big Up move. Don't know when it will breakout of this consolidation. If it breaks out , sometimes it can comeback to this level to consolidate more, so that it can make a big move up later.
One thing i learned from all these years is Patience is the most important thing an investor(or trader) needs, if you act on your emotions and sells the stocks because you are bored and market is going no where, that's when it goes up. How many times that happened to you?Many times for me. Learning new lessons everyday.

Tuesday, December 06, 2005

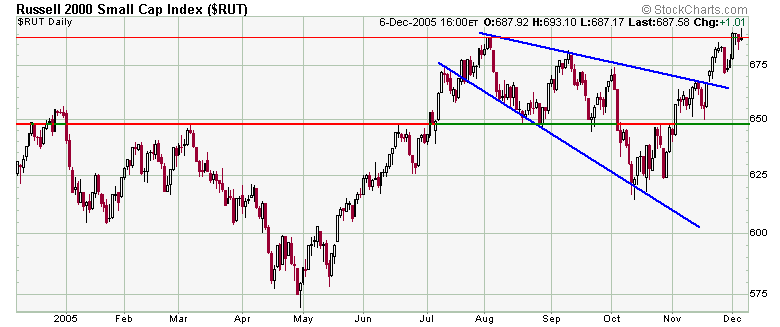
Russell 2000 and Market tired


Even though Russell 2000, brokeout of its prior high, it came back to that level and is stuck there for the past days. The market is telling us that it's tired of going higher, it needs more energy and inorder to get that it needs to consolidate . I think the market will trade in a range for the next couple of weeks.
As mentioned in a chart below, Oil stopped at the trendline and is climbing up. Oil may be on its last gasp higher, before it goes into a minor bear.

Sunday, December 04, 2005

Bye Bye Nasdaq 2000, Hello 3000

When Nasdaq bottomed in 2002, it did that just above the 1000 point mark. Nasdaq reached the 2000 area around the first part of 2004 and it stayed around that area for the past 22 months(almost 2 years). Now it build a very good base around the 2000 area and now looking forward to meet the next multiple , 3000.But if you look at the chart above, the move up is going to get stopped at around 2775, a point similar to the area nasdaq just left(shown by the down blue arrows). Before it gets there the market will have to make a stop just below 2350 and build enough base to attack and move to the next resistance level at 2775.Going above 2775, is for another day,it may take years, but eventually will, we will see when it gets there. So bye bye 2000.

Followers