Sunday, March 25, 2012

Bonds are going down long term

The chart above is for TLT, which is a treasury bond ETF.  Investors buy treasury bonds when rest of the market is in trouble. Since investors have been moving to the stock market, treasuries have come down gradually. As you can see , TLT has solid support at the up trend-line, where it has stopped many times over the years and i guess it will stop again at that line. (If it ever falls below that line, you can kiss good bye to low interest rates for a long time. It could happen if inflation some how gets to a very high level, like in the early 1980s.). Not sure how long it will take for the TLT to come down and meet the trend-line. This is one of the reason i'm bullish on the stock market in the long-term.
possible trades: Short TLT  or long TBT (inverse ETF)

Disclaimer: The information on this blog is not a recommendation or solicitation to buy, sell or hold any security. This blog is strictly for informational and educational purposes only.

Saturday, March 24, 2012

Market to Sell-Off and Consolidate

The Market has been going up with out a major sell off in the past 3 months. I think it's time for a pullback and consolidation. As the chart shows, the S&P500 will be hitting the up trend-line pretty soon and it might rally from there or go below it. I think the  Market will be weak for the next couple of months, but not sure whether it will go down a lot too. We have to see how it consolidates here and whether it will create to a pattern to go up or down (My long-term prediction is the Market could go to 1500 area in the second half of the year, but there's no guarantee for that too). Once we Sell-off and consolidates i will post where it will be going next.

Saturday, December 10, 2011

To 1350 (not Infinity) and Beyond


As was said in the last post the market has been trending down and going sideways  for the past 6 months along with the uptrend in Bonds. I think we are at a stage where the market could start trending higher and Bond to trend lower , but not in a straight line though (see chart for a possible pattern) . But in the 2nd half of 2012, we could see the market(S&P500)  challenging 1400  and above.

Thursday, May 05, 2011

When Bonds Turn Up Stocks Retreat

Bonds have been in an uptrend for a long time , as the chart shows, it has been in that uptrend for almost 25 years. whenever the bond price bounces from the lower trendline, stocks go into a weak phase and vice-versa. I think stocks are going to be weak for the next couple of months. My guess is that S&P500 will remain weak and go into a downtrend phase, but later it will mount another rally to the 1500's during the election year(2012).

Sunday, September 26, 2010

Continuation of Up Trend

Updated chart from prior post. As in prior post , i think the market is still in the process of a sideways trading range and eventually will break above 1220(the top line), but the timing is uncertain. My initial target is 1250 for the current up trend. and then the next up cycle will take it to 1350.
Saturday, June 05, 2010

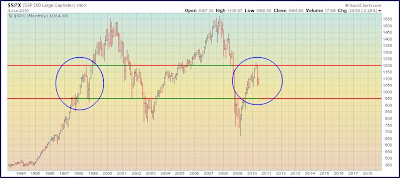
is SPX retracing an old pattern?

(click image to enlarge)
Market's run from March 2009 finally stopped at 1220 and we have moved into a bear market pattern unless market climbs back above 1105 quickly. In the graph above, if the current pattern retraces a similar move back in 1997-1998(Asian currency crisis) i guess 950 is the bottom of the range(Do we call that Euro crisis?). I still don't know if the market will come all the way down to 950, but it should stay above 950 if it comes down. If the market climbs above 1105 in the near term, this bearish pattern is negated. Also 1010 area is a support area above 950.

Saturday, September 26, 2009

Market encounters head winds

Since crossing 950 after the bull-bear tug-o-war(as mentioned in the prior blog entry), the market
gained almost 14%. It has been going up for the last seven months and we are just below a major resistance area in the s&p500 index. 1100-1150 is another area that has shown some consolidation in the prior up-down moves as you can see in the chart, ie. the market does not shoot straight up but consolidate or sell-off before moving up. If the market sells off then 950-980 area should provide good support.If it goes below 950 and stay below it then we have a major problem and will lead to another downturn in economic conditions. But at this point , i think the market will consolidate between 950 and 1125 and eventually go up to regain new highs.

Followers